Hurricane Janet 1955

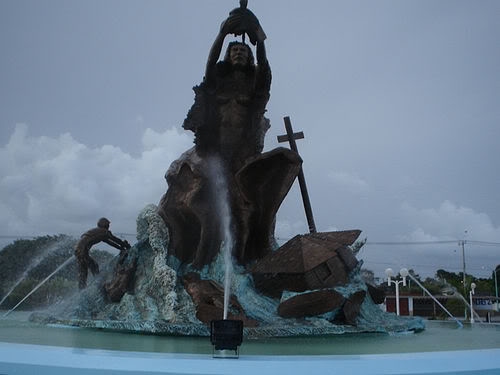
Renaissance Monument after Hurricane Janet (1955)

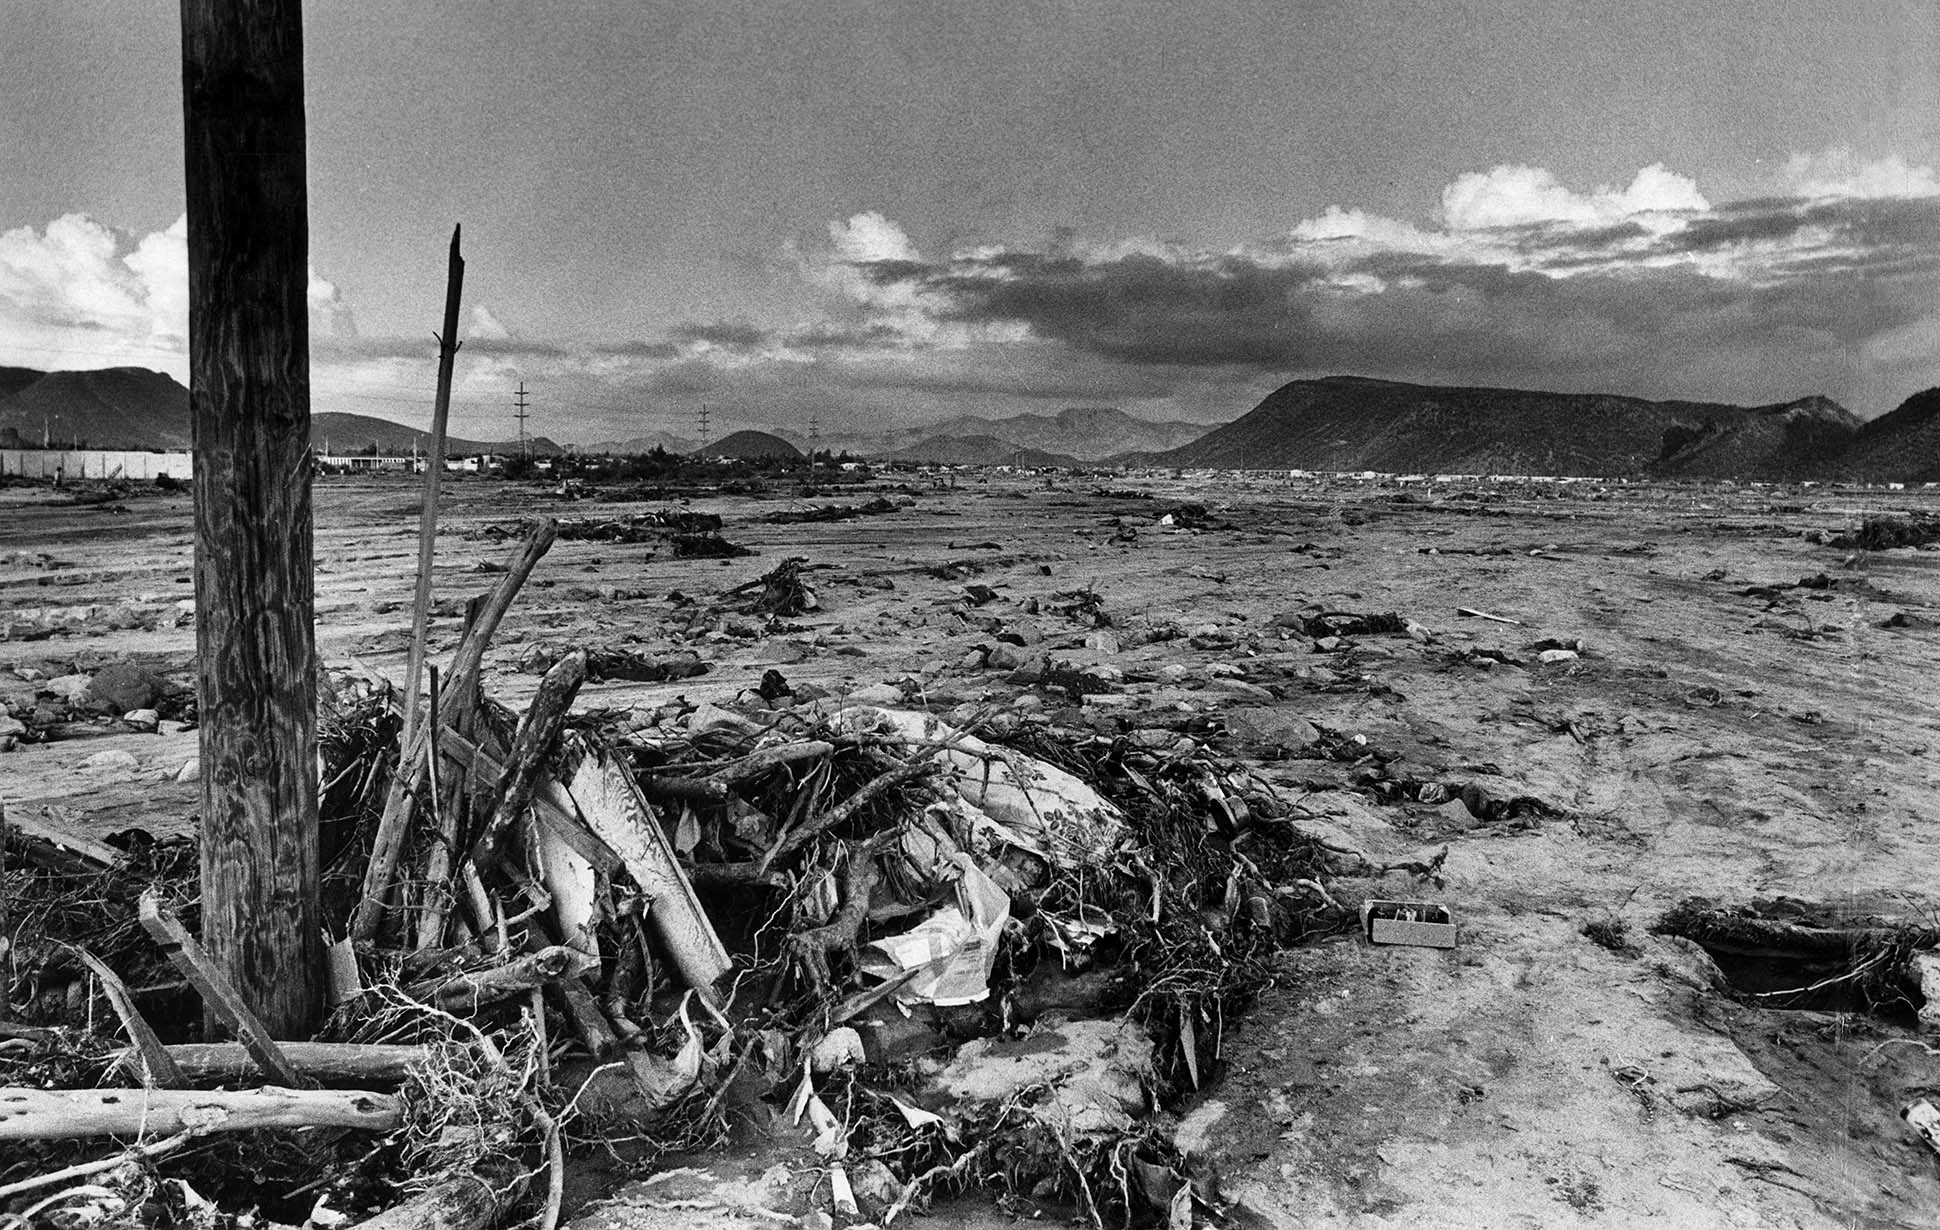
It is the first of which there is a record. The Hurricane Janet cataloged as category 5 on the Saffir-Simpson scale, made landfall on September 27, 1955, in Quintana Roo. According to the press of the time, the most affected city was precisely its capital, Chetumal, leaving 712 dead in its wake (data from Cenapred ) and devastated practically all the houses that were found since most of them were made in such a way.

Unusual cases:
Each hurricane has its own way of leaving its mark and leaving something in particular that the population does not forget, in the case of Hurricane Janet, how to forget the flag that crossed a tree, from which there is a replica on the esplanade of the flag (main park of Chetumal). Another unusual case is that of the “flying house” and the concrete pond that was wound on a palm tree. The "flying house" exists is made of wood and zinc sheet, it is on the Veracruz road with 22 de Enero corner in the center of the city. The anecdote, " was dragged more than 500 meters from its initial location, with about 25 people inside, during the impact of Janet" .

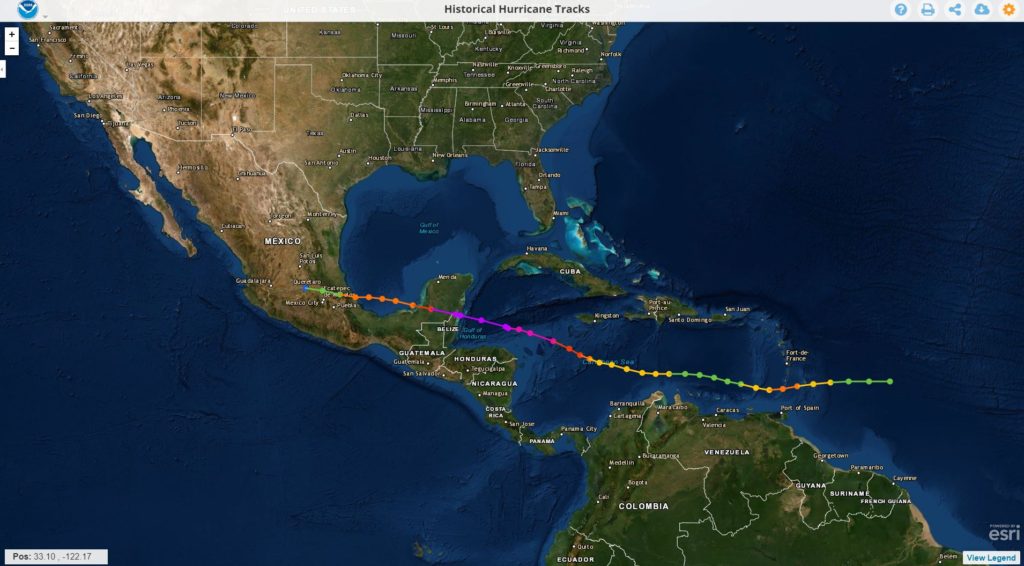
This was the path Janet took
As it happens in our days, many people left the protection of their family and their homes until the end . Expensive they would pay big mistake. In addition, just a few days earlier, on September 19, another hurricane had visited south of Quintana Roo "Hilda" that had basically passed through the area of ​​Felipe Carrillo Puerto, causing very slight damage in Chetumal. Then it was naively thought that this had already covered the "annual quota" of hurricanes, today we know that this does not work that way, even the worst was lacking ...

What is an Extratropical Cyclone?

Es un sistema atmosférico cuya fuente primaria de energía es el gradiente horizontal de la temperatura. Los ciclones extratropicales son sistemas de baja presión asociados a frentes fríos, cálidos o ocluídos. Los ciclones tropicales, a diferencia de los extratropicales, no manifiestan un gradiente horizontal de temperaturas tan sustancial en todo el diámetro de la tormenta, a nivel de la superficie, y sus vientos son generados por la liberación de energía durante la formación de las nubes y la lluvia; estos se componen por dos o más masas de aire (cálido o frío), por lo tanto se asocia a uno o más frentes.

The upper diagrams show horizontal maps of surface temperature, pressure, and wind fields associated with a tropical cyclone (left) and an extratropical cyclone (right) . Colors indicate temperature (blue 15 ° C = 59 ° F, green blue 20 ° C = 68 ° F, green 25 ° C = 77 ° F). Dashed lines indicate surface wind speeds: 34 kt = 39 mph = 63 kph, 64 kt = 74 mph = 117 kph, and 96 kt = 110 mph = 174 kph. Continuous lines are the isobars.
The diagrams below show maps of vertical pressure surfaces, temperature anomalies, and surface circulation and tropopause.

The strongest winds in a tropical cyclone occur near the earth's surface, while in an extratropical cyclone the strongest winds occur near the tropopause (at a height of 12 km (8 miles). These differences arise as a consequence of that the tropical cyclone has a "warm core" in the troposphere (below the tropopause), while the extratropical cyclone has a cold core in the troposphere and warm in the stratosphere (above the tropopause). The expression "warm core" it means that the center of the cyclone is warmer than the environment at the periphery of the storm, on the same isobaric surface (speaking of isobaric surfaces is like speaking of heights from the ground). Contribution Stan Goldenberg source: NOA