


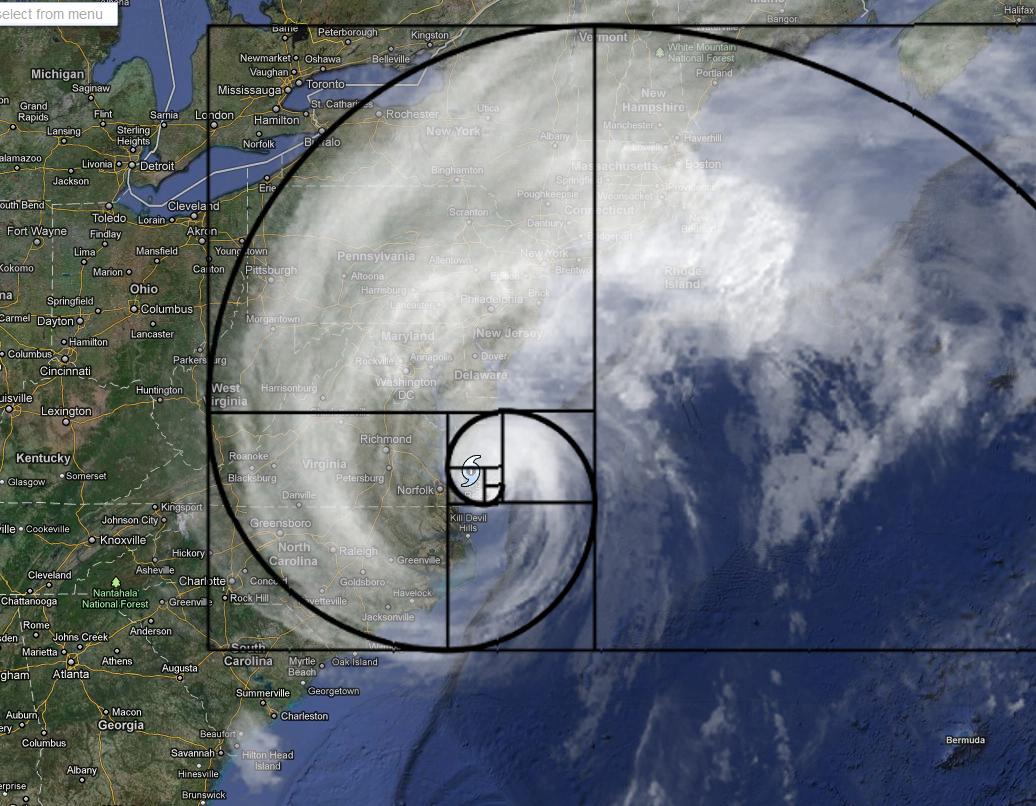
Hurricanes, earthquakes, and other natural disasters follow the same mathematical patterns.
If you take note of the magnitude of various catastrophic natural events and plot how often each type has occurred throughout history, the outcome isn’t random at all. Quite the opposite—it tends to follow a clear, well-defined curve. The good news? The more destructive an event is, the less frequently it tends to occur.
Take earthquakes, for example. Only a small number of them are truly catastrophic. In contrast, smaller quakes happen all the time—many so mild that people don’t even feel them. These minor tremors often go completely unnoticed, detectable only by highly sensitive instruments. But tracking this information is essential to better understand and calculate risk.
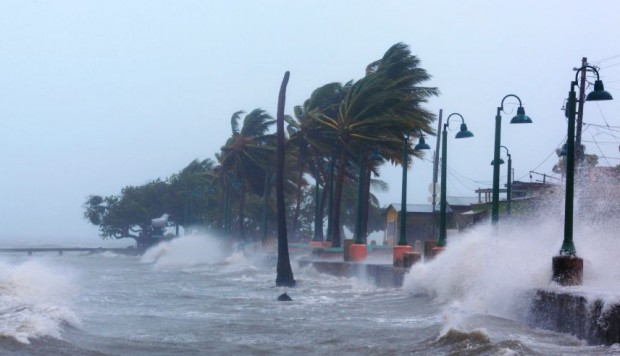
Still, this pattern isn’t always identical across different types of disasters, especially when it comes to the largest and rarest events. Researchers Álvaro Corral and Álvaro González, from the Centre for Mathematical Research (CRM) and the Mathematics Department at UAB, conducted an in-depth statistical analysis of several natural phenomena that can lead to disasters—including earthquakes, hurricanes, wildfires, meteorite impacts, flash floods, and land collapses.
By analyzing thousands of recorded events of varying intensity, they were able to describe a common mathematical pattern that links the frequency of these events to their magnitude or size. Most of them follow what's known as a power law—a principle that shows smaller events are far more common than larger ones. And interestingly, there's no such thing as a "typical" or average size for these occurrences.